1. 우리는 왜 영화관을 안갈까?
마지막으로 영화관을 간게 10년되었다…(가디언즈 오브 갤럭시가 저의 영화관 마지막 영화…)
비싸고, 좁고, 시끄럽고, 두시간동안 돈을 내고 고통받기 싫어서 안가게됨

20년간의 티켓 가격 추이 (일반 좌석 기준)
영화진흥위원회에서 해당 데이터를 볼수 있습니다.
| 연도 | 영화진흥위원회 평균가 | 롯데시네마 | CGV | 메가박스 |
| 2004 | 6,364 | 7,000원 | 8,000원 | 7,000원 |
| 2008 | 6,521 | 8,000원 | 9,000원 | 8,000원 |
| 2009 | 6,970 | 9,000원 | 10,000원 | 9,000원 |
| 2010 | 7,832 | 10,000원 | 10,000원 | 10,000원 |
| 2013 | 7,271 | 11,000원 | 11,000원 | 11,000원 |
| 2014 | 7,738 | 12,000원 | 12,000원 | 12,000원 |
| 2016 | 8,032 | 13,000원 | 13,000원 | 13,000원 |
| 2018 | 8,383 | 14,000원 | 14,000원 | 14,000원 |
| 2021 | 9,657 | 15,000원 | 15,000원 | 15,000원 |
영화진흥위원회는 티켓값이 안비싸다고 한다…ㅋㅋㅋㅋ

저 가격이면 2넷플릭스

넷플릭스 멤버십 및 요금
요금(한국 원화)
- 광고형 스탠다드: 월 7,000원
- 스탠다드: 월 13,500원
- 1명 등록 가능: 광고형 멤버십의 경우 월 4,000원, 광고 없는 멤버십의 경우 월 5,000원
- 프리미엄: 월 17,000원
- 최대 2명 등록 가능: 광고형 멤버십의 경우 1명당 월 4,000원, 광고 없는 멤버십의 경우 1명당 월 5,000원
결론 : 영화관은 망하는게 맞겠다..


2. 데이터를 모아보자.
KOBIS에서는 일별 영화 관객수를 제공해준다. (KOBIS 일별 총관객수 및 매출액)
수집 데이터 (5년 관람객 데이터)
from selenium import webdriver
from selenium.webdriver.support.ui import Select, WebDriverWait
from selenium.webdriver.support import expected_conditions as EC
from selenium.webdriver.common.by import By
import pandas as pd
import time
from datetime import datetime

options = webdriver.ChromeOptions()
# options.add_argument('--headless')
driver = webdriver.Chrome(options=options)

url = 'https://www.kobis.or.kr/kobis/business/stat/them/findDailyTotalList.do'
driver.get(url)

wait = WebDriverWait(driver, 10)
all_data = []

for year in range(2020, datetime.now().year + 1):
    for month in range(1, 13):
        if year == datetime.now().year and month > datetime.now().month:
            break

        try:
            # 연도, 월 선택
            Select(driver.find_element(By.ID, 'selectYear')).select_by_value(str(year))
            Select(driver.find_element(By.ID, 'selectMonth')).select_by_value(str(month).zfill(2))

            # 조회 버튼 클릭
            driver.find_element(By.XPATH, '//button[contains(text(), "조회")]').click()

            # 테이블 로딩까지 대기 (class 기반)
            wait.until(EC.presence_of_element_located((By.CSS_SELECTOR, 'table.tbl_comm.tbl_min_width tbody tr')))

            # 행 수집
            rows = driver.find_elements(By.CSS_SELECTOR, 'table.tbl_comm.tbl_min_width tbody tr')

            # 마지막 행은 합계 row이므로 제외
            for row in rows[:-1]:
                cols = row.find_elements(By.TAG_NAME, 'td')
                if len(cols) == 15:
                    row_data = [col.text.strip().replace(',', '').replace('%', '') for col in cols]
                    all_data.append(row_data)

            print(f"수집 완료: {year}-{month:02d}")
            time.sleep(1)
        except Exception as e:
            print(f"에러: {year}-{month:02d} / {e}")
            continue
driver.quit()
columns = [
    '날짜',
    '한국_개봉편수', '한국_상영편수', '한국_매출액', '한국_관객수', '한국_점유율',
    '외국_개봉편수', '외국_상영편수', '외국_매출액', '외국_관객수', '외국_점유율',
    '전체_개봉편수', '전체_상영편수', '전체_매출액', '전체_관객수'
]

df = pd.DataFrame(all_data, columns=columns)
df.to_csv('kobis_daily_box_office.csv', index=False, encoding='utf-8-sig')
5년간의 관람객 추이를 알아보자
import pandas as pd
import matplotlib.pyplot as plt
from matplotlib import font_manager
font_path = './NanumGothic-Regular.ttf'
font_manager.fontManager.addfont(font_path)
plt.rcParams['font.family'] = 'NanumGothic'

# 파일 로드
file_path = "./kobis_daily_box_office.csv"
df = pd.read_csv(file_path)

# 상위 5개 행 확인
# df.head()


import matplotlib.pyplot as plt

# 문자열 숫자형 칼럼들을 정수로 변환
df["전체_관객수"] = df["전체_관객수"].astype(str).str.replace(",", "").astype(int)
df["한국_관객수"] = df["한국_관객수"].astype(str).str.replace(",", "").astype(int)
df["외국_관객수"] = df["외국_관객수"].astype(str).str.replace(",", "").astype(int)
df["날짜"] = pd.to_datetime(df["날짜"])

# 날짜 기준 정렬
df = df.sort_values("날짜")

# 전체 관객수 추이 그래프
plt.figure(figsize=(12, 4))
plt.plot(df["날짜"], df["전체_관객수"], label="전체 관객수")
plt.title("전체 관객수 추이")
plt.xlabel("날짜")
plt.ylabel("관객수")
plt.grid(True)
plt.tight_layout()
plt.show()

코로나 이후 극장가 회복 국면에서 반복적으로 급증/급감 현상
2022년 5월~2023년 6월 사이 특히 변동성이 크며, 이는 팬데믹 회복과 개봉작 편중의 영향으로 분석됨
관객 수 급증 (이유: 공휴일, 인기 개봉작, 방역 해제 등)
- 2022~2023년: 백신 접종률 상승과 사회적 거리두기 완화로 관객 수 회복
- 2023-06: 범죄도시3, 스파이더맨: 어크로스 더 유니버스 등 대작 개봉
- 2024-12 : 연말 + 각종 영화 합계가 1500만을 넘김
- 명절 및 연휴 전후: 관람객이 일시적으로 급등 (추석, 설날, 어린이날 등)
10년 관객수 추이

망했네…
| 연도 |
일별 평균 관객수 |
| 2015 | 595,341명 |
| 2016 | 592,968명 |
| 2017 | 602,401명 |
| 2018 | 592,836명 |
| 2019 | 621,036명(최고치) |
팬데믹 이전 관객수 추세
- 꾸준히 일별 59~62만 명 수준을 유지하며 안정적임
- 2019년은 역대 최고 수준의 평균 관객수
- 전반적으로 극장 산업은 팬데믹 전까지는 영화 성숙기의 시작이였다
한국 - 외국 영화 관객수 추이

- 2015~2019년
- 한국 영화와 외국 영화 모두 계절적 성수기(설날, 추석, 여름 방학 등)에 반복적인 상승 패턴 (가족영화 + 아동용)
- 외국 영화는 주로 여름/겨울 대작에 집중되는 경향 (예: 마블, 디즈니)
- 2020~2021년 팬데믹 기간
- 두 분야 모두 급감
- 특히 외국 영화는 개봉 자체가 크게 줄며 장기간 저조한 수준 유지
- 2022~2024년 회복기
- 한국 영화는 상대적으로 빠르게 회복, 일부 구간은 외국 영화를 초과
- 외국 영화는 회복세가 더딘 편 (수입사 파산이 큰영향으로 보임 == 대작 아니면 안가지고옴 → OTT나 봐야겄다 )
월별 개봉 영화 추이
import matplotlib.pyplot as plt
import pandas as pd
import matplotlib.pyplot as plt
from matplotlib import font_manager
font_path = './NanumGothic-Regular.ttf'
font_manager.fontManager.addfont(font_path)
plt.rcParams['font.family'] = 'NanumGothic'

file_path = "./kobis_daily_box_office_10년.csv"
df_10y = pd.read_csv(file_path)


df_10y["날짜"] = pd.to_datetime(df_10y["날짜"], errors="coerce")
df_10y["연도-월"] = df_10y["날짜"].dt.to_period("M")


df_10y["전체_개봉편수"] = df_10y["한국_개봉편수"].astype(str).str.replace(",", "").astype(int) + \
                        df_10y["외국_개봉편수"].astype(str).str.replace(",", "").astype(int)


monthly_release = df_10y.groupby("연도-월")["전체_개봉편수"].sum().reset_index()
monthly_release["연도-월"] = monthly_release["연도-월"].astype(str)

# 시각화
plt.figure(figsize=(14, 6))
plt.plot(monthly_release["연도-월"], monthly_release["전체_개봉편수"], marker='o')
plt.xticks(rotation=90)
plt.title("월별 개봉 영화 편수 (한국 + 외국)")
plt.xlabel("연도-월")
plt.ylabel("개봉 편수")
plt.grid(True)
plt.tight_layout()
plt.show()

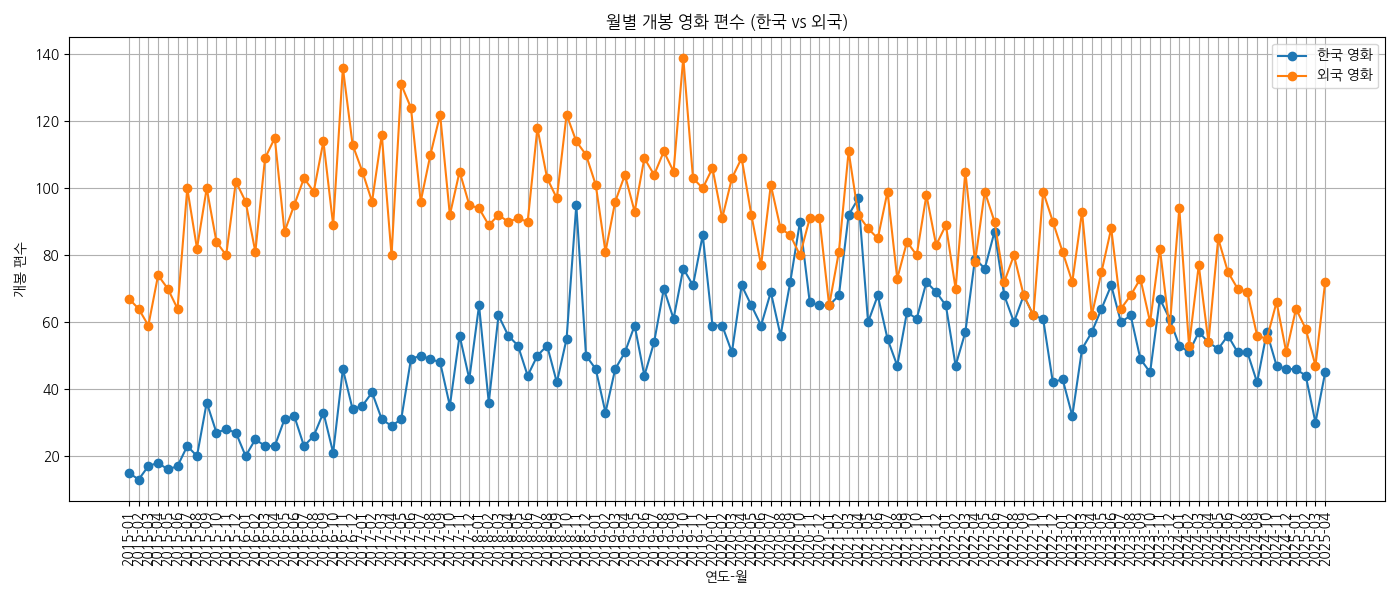
- 2015~2019년: 매달 200편 이상 개봉하는 꾸준한 흐름 (비수기 100~150편)
- 2020~2021년 팬데믹 시기: 개봉 수 급감 (최소 10~50편 수준)
- 2022년 이후 회복세: 다시 100~200편대로 점진적 복귀
- 여름(7~8월), 연말(12월)에는 상대적으로 개봉작이 증가하는 경향
월별 영화 매출 추이
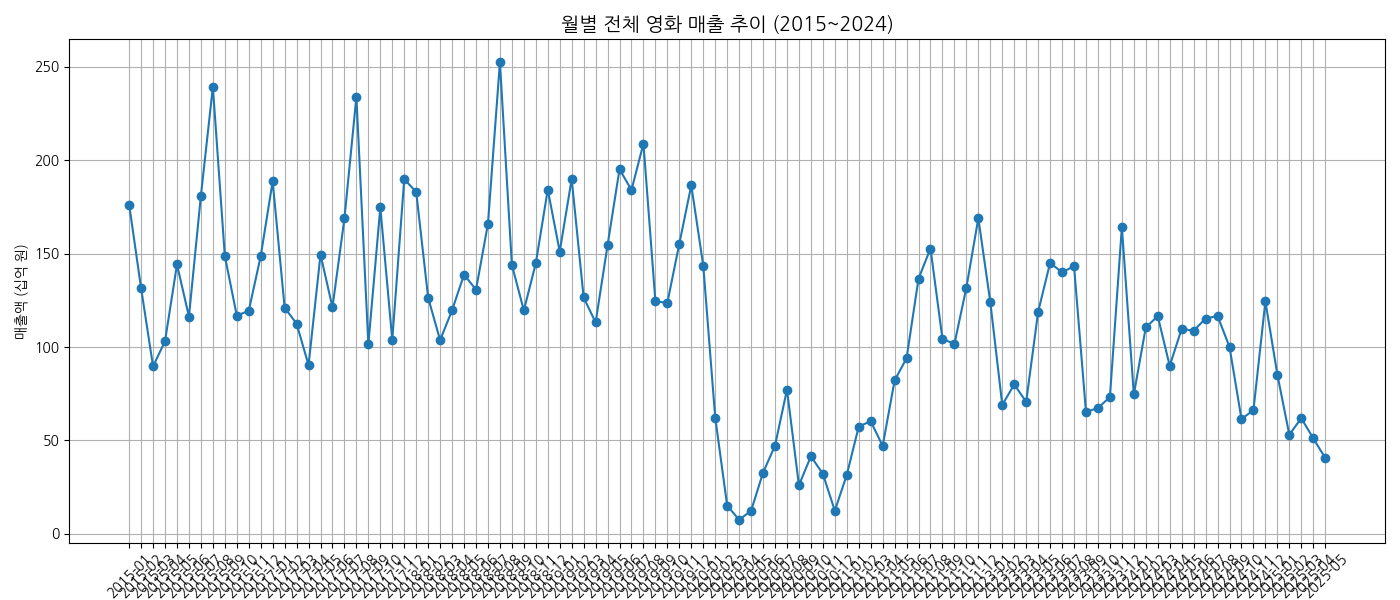
| 연도 | 총 매출액 (원) | 총 관객수 (명) |
| 2015 | 1.72조 | 2.17억 |
| 2017 | 1.76조 | 2.20억 |
| 2018 | 1.81조 | 2.16억 |
| 2019 | 1.91조 | 2.27억 ← 최고치 |
| 2020 | 0.51조 | 0.59억 ← 팬데믹 급감 |
- 팬데믹 이전
- 계절성은 존재하지만 전반적으로 높은 평균 매출 유지
- 팬데믹 이후
- 2022년 하반기~2023년: 일부 월은 팬데믹 이전 수준 근접 (1,500억 이상) - 부분 회복
- 2024년: 다시 800~1,200억 원 수준에서 정체, 완전한 회복은 아직 미완
3. 앞으로를 예측 해보자
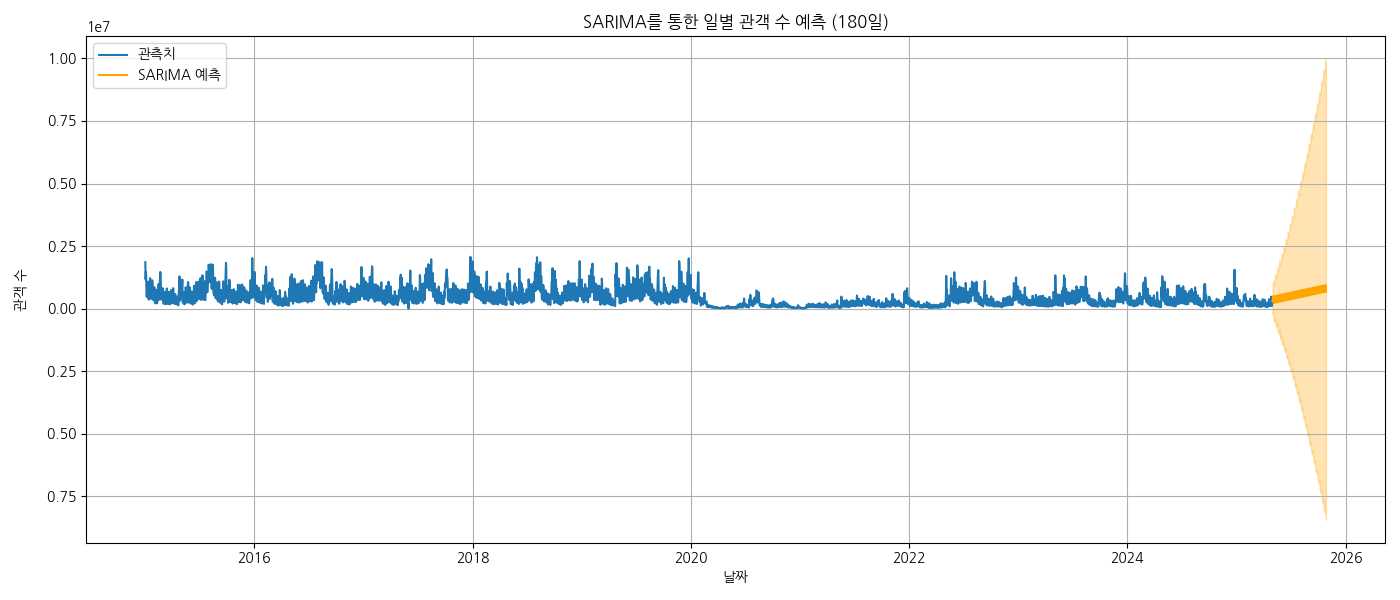
앞으로의 전체 관람객 수를 예측 해보자.
시계열 예측
SARIMA 시계열 데이터 예측에서 자주 사용되는 통계 모델.
SARIMA는 Seasonal ARIMA의 줄임말로,
기본적인 ARIMA 모델에 계절성(Seasonality) 요소를 추가한 모델입니다.
| 상황 | 설명 |
| 추세(Trend) 있음 | 장기적으로 증가 or 감소하는 경향 |
| 계절성(Seasonality) 있음 | 주기적으로 반복되는 패턴 (예: 주말, 연말) |
| 최근 관측치가 미래에 영향 | 관객 수처럼 이전 값이 다음 값에 영향을 주는 경우 |
| 외부 요인 반영 어려움 | 휴일, 이벤트, 개봉일 등 외부 변수 반영 불가 |
| 수작업 파라미터 튜닝 | (p,d,q)(P,D,Q,s)를 직접 찾아야 정확도 향상 |
SARIMA(p, d, q)(P, D, Q, s)- (p, d, q): 비계절성 ARIMA 파라미터
- (P, D, Q, s): 계절성 파라미터 (s는 계절 주기)
import pandas as pd
from statsmodels.tsa.statespace.sarimax import SARIMAX
import matplotlib.pyplot as plt


from matplotlib import font_manager
font_path = './NanumGothic-Regular.ttf'
font_manager.fontManager.addfont(font_path)
plt.rcParams['font.family'] = 'NanumGothic'

df = pd.read_csv("kobis_daily_box_office_10년.csv")
df["날짜"] = pd.to_datetime(df["날짜"])
df = df.sort_values("날짜")


# 결측치
if "전체_관객수" in df.columns:
    df["전체_관객수"] = (
        df["전체_관객수"]
        .astype(str)
        .str.replace(",", "", regex=False)
        .str.extract(r"(\d+\.?\d*)")[0]
    )

    df["전체_관객수"] = pd.to_numeric(df["전체_관객수"], errors="coerce").fillna(0).astype(int)

df.set_index("날짜", inplace=True)

# SARIMA 모델 학습 (파라미터는 기본 예시) 튜닝 필요
model = SARIMAX(df["전체_관객수"], order=(1,1,1), seasonal_order=(1,1,1,7), enforce_stationarity=False, enforce_invertibility=False)
sarima_result = model.fit(disp=False)

# 향후 180일 예측
forecast_sarima = sarima_result.get_forecast(steps=180)
forecast_index = pd.date_range(start=df.index[-1] + pd.Timedelta(days=1), periods=180)

forecast_mean = forecast_sarima.predicted_mean
forecast_ci = forecast_sarima.conf_int()

# 시각화
plt.figure(figsize=(14, 6))
plt.plot(df["전체_관객수"], label="관측치")
plt.plot(forecast_index, forecast_mean, label="SARIMA 예측", color="orange")
plt.fill_between(forecast_index, forecast_ci.iloc[:, 0], forecast_ci.iloc[:, 1], color="orange", alpha=0.3)
plt.title("SARIMA를 통한 일별 관객 수 예측 (180일)")
plt.xlabel("날짜")
plt.ylabel("관객 수")
plt.legend()
plt.grid(True)
plt.tight_layout()
plt.show()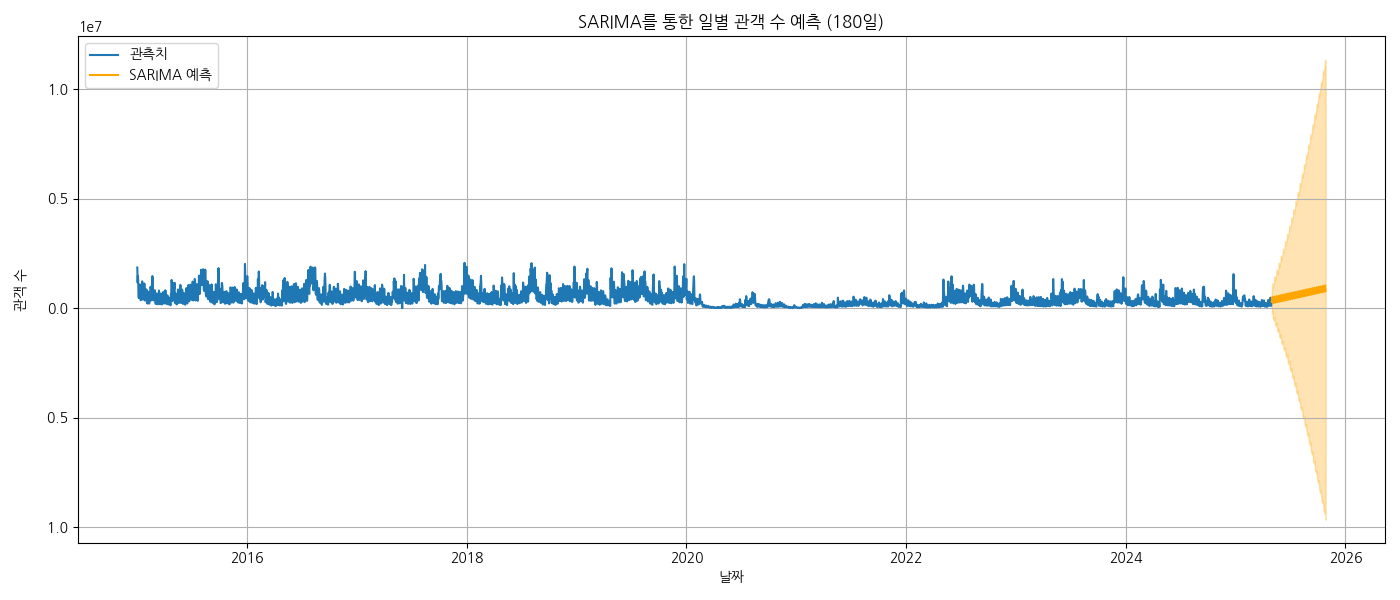
파라미터 튜닝
model = auto_arima(
    df["전체_관객수"],
    start_p=1, start_q=1,
    max_p=3, max_q=3,
    seasonal=True,
    m=7,  # 7일 주기
    start_P=0, start_Q=0,
    max_P=2, max_Q=2,
    d=1, D=1,
    stepwise=True,
    trace=True,
    error_action="ignore",
    suppress_warnings=True
)

model.summary()
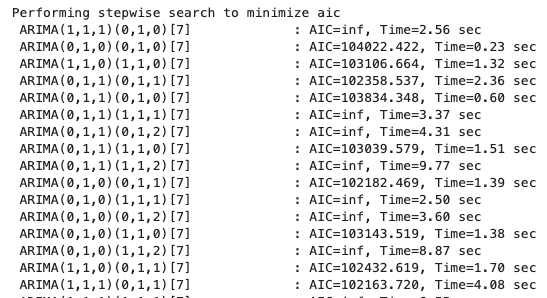
AIC (Akaike Information Criterion) 는 모델의 적합도(accuracy) 와 복잡도(complexity) 사이의 균형을 평가하는 지표
AIC가 낮을 수록 성능이 좋을 가능성이 올라감

별다른 소용이 없는듯 하다.
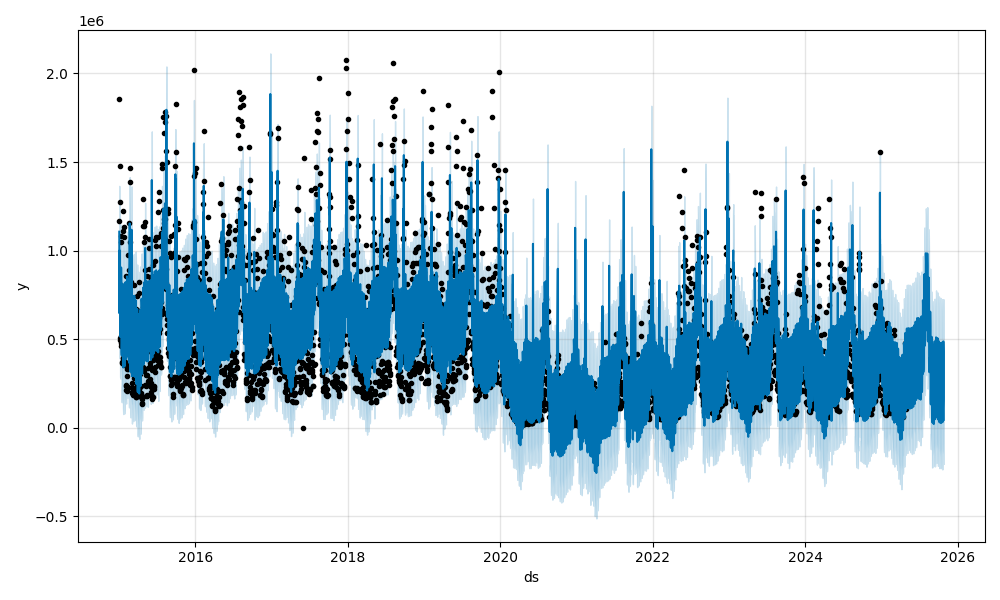
Prophet은 Facebook에서 개발한 시계열 데이터 예측 라이브러리(Additive 모델 - 선형 기반)로, 비전문가도 신뢰성 높은 시계열 예측을 쉽게 할 수 있도록 설계
| 기능 | 설명 |
| 트렌드 자동 감지 | 꺾이는 지점(변곡점)도 스스로 찾아냄 |
| 결측값/이상치에 강함 | robust fitting 옵션 있음 |
| 휴일 영향 반영 가능 | add_country_holidays() 지원 |
| 다양한 주기 반영 가능 | 연간/주간 외 사용자 정의 주기도 가능 |
| 인터랙티브하게 튜닝 가능 | 변곡점 수, 계절성 강도 등 |
from prophet import Prophet
import pandas as pd
import holidays

kr_holidays = holidays.KR(years=range(2015, 2025))
holiday_df = pd.DataFrame([
    {"ds": pd.to_datetime(date), "holiday": name, "lower_window": 0, "upper_window": 1}
    for date, name in kr_holidays.items()
])


df = pd.read_csv("kobis_daily_box_office_10년.csv")
df["날짜"] = pd.to_datetime(df["날짜"])

if "전체_관객수" in df.columns:
    df["전체_관객수"] = (
        df["전체_관객수"]
        .astype(str)
        .str.replace(",", "", regex=False)
        .str.extract(r"(\d+\.?\d*)")[0]  # 숫자 또는 소수만 추출
    )

    df["전체_관객수"] = pd.to_numeric(df["전체_관객수"], errors="coerce").fillna(0).astype(int)

    # Prophet용 포맷
    df_prophet = df[["날짜", "전체_관객수"]].rename(columns={"날짜": "ds", "전체_관객수": "y"})

model = Prophet(yearly_seasonality=True,
                weekly_seasonality=True,
                daily_seasonality=False,
                holidays=holiday_df
)
model.fit(df_prophet)


# 6개월 예측
future = model.make_future_dataframe(periods=180)
forecast = model.predict(future)

model.plot(forecast)
model.plot_components(forecast)


import matplotlib.pyplot as plt


fig1 = model.plot(forecast)
plt.show()

fig2 = model.plot_components(forecast)
plt.show()

참고 사항
https://www.youtube.com/watch?v=ZlPt4HfQAt4
https://www.youtube.com/watch?v=dzIFLBCEKac
https://www.youtube.com/watch?v=ITn9_EqIXr0
https://monthlydatanote.notion.site/1ead0e76ed44819486f9d590041faf94
영화관은 정말 사양 산업일까? | Notion
1. 분석 주제 및 목적
monthlydatanote.notion.site
'ML > 데이터 분석' 카테고리의 다른 글
| CoxPHFitter (2) | 2025.07.23 |
|---|---|
| 2. 3점 슛이 코트를 지배하는가? (1) | 2025.07.05 |
| Error: unsupported locale setting (1) | 2024.07.31 |
| ipynb 파일에는 metadata가 있습니다! (0) | 2024.01.06 |
| ubuntu 크롬드라이버 && 크롬 브라우저 설치 링크 사이트 (0) | 2023.02.09 |


