https://www.youtube.com/watch?v=4M8Xv_GOUsc
요즘 보는 드라마의 한장면에서 주인공이 코딩으로 계획표를 만드는 부분이 나왔다. (youtube 제목도 코딩으로 생활 꼐획표 짜는 상위 0.01% 천재..)
보자마자 "저거 안될텐데?" 라는 생각부터 들기 시작한건...직업병인가?
일단 시작부터 python 문법인데, 파일명이 indexj.jsp 다. (뭐 이런건 사소한거니 넘어가고)

드라마에서 만든 계획표... 파이썬으로 이거 못만들어요...ㅋㅋ (그래픽 모듈을 써야 가능)

일단 matplotlib 을 기준으로 만들어보았다. 간단하게 파이차트를 활용해서 만들면 되지 않을까 싶었다.
import matplotlib.pyplot as plt

activities = [
    "꿈나라", "아침", "게임하기", "멍때리기", "점심",
    "TV보기", "낮잠자기", "만화방 가기", "자유시간", "명상"
]
start_times = [0, 5, 6, 9, 11, 13, 15, 18, 20, 21]
end_times = [5, 6, 9, 11, 13, 15, 18, 20, 21, 24]

durations = [end - start for start, end in zip(start_times, end_times)]

colors = [
    '#FFFFFF', '#FFFFFF', '#FFFFFF', '#FFFFFF', '#FFFFFF',
    '#FFFFFF', '#FFFFFF', '#FFFFFF', '#FFFFFF', '#FFFFFF'
]

fig, ax = plt.subplots()
ax.pie(durations, labels=activities, startangle=90, colors=colors, counterclock=False, wedgeprops={'edgecolor': 'black'})

centre_circle = plt.Circle((0, 0), 0.30, fc='white')
fig.gca().add_artist(centre_circle)


ax.axis('equal')


plt.text(0, 0, 'PLAY', ha='center', va='center', fontsize=18, fontweight='bold')

plt.show()
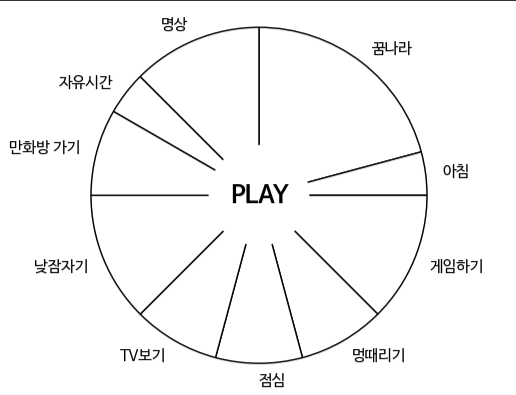
결과물.
구분은 되지만, 시간 표기가 없어서. 심심함 느낌이 난다. (계획표가 아닌 그냥 파이그래프로 보인다.)

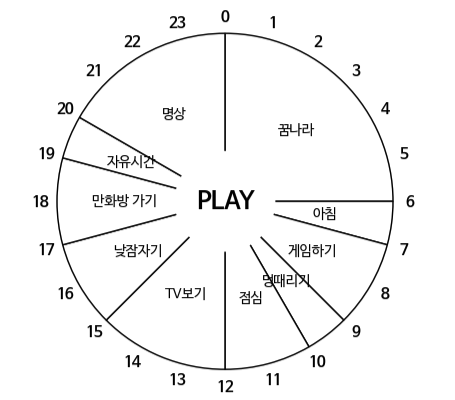
시간 표기는 gpt의 도움을 받아서 해보았다.
import numpy as np
import matplotlib.pyplot as plt


activities = [
    "꿈나라", "아침", "게임하기", "멍때리기", "점심",
    "TV보기", "낮잠자기", "만화방 가기", "자유시간", "명상"
]
start_times = [0, 6, 7, 9, 10, 12, 15, 17, 19, 20]
end_times = [6, 7, 9, 10, 12, 15, 17, 19, 20, 24]


durations = [end - start for start, end in zip(start_times, end_times)]


colors = [
    '#FFFFFF', '#FFFFFF', '#FFFFFF', '#FFFFFF', '#FFFFFF',
    '#FFFFFF', '#FFFFFF', '#FFFFFF', '#FFFFFF', '#FFFFFF'
]


fig, ax = plt.subplots()
wedges, texts = ax.pie(durations, startangle=90, colors=colors, counterclock=False, wedgeprops={'edgecolor': 'black'})


for i, text in enumerate(texts):
    angle = (start_times[i] + end_times[i]) / 2 * 360 / 24
    x = 0.6 * np.cos(np.deg2rad(-angle + 90))
    y = 0.6 * np.sin(np.deg2rad(-angle + 90))
    ax.text(x, y, activities[i], ha="center", va="center", fontsize=10)


for i in range(24):
    angle = i * 360 / 24
    x = 1.1 * np.cos(np.deg2rad(-angle + 90))
    y = 1.1 * np.sin(np.deg2rad(-angle + 90))
    ax.text(x, y, f'{i}', ha="center", va="center", fontweight="bold")


centre_circle = plt.Circle((0, 0), 0.30, fc='white')
fig.gca().add_artist(centre_circle)


ax.axis('equal')


plt.text(0, 0, 'PLAY', ha='center', va='center', fontsize=18, fontweight='bold')

plt.show()
최종 결과물. 흠.. 어느 정도 괜찬은 느낌이 난다. 아마 색상만 더 입히면 쓸만할지도?

끝
'쓰레기장""' 카테고리의 다른 글
| docker로 sqld 실습환경 만들기 (0) | 2022.05.04 |
|---|---|
| 요즘 같은 세상에.... (0) | 2021.12.20 |
| 지구야 미안해!! (0) | 2020.07.18 |
| 월세로 집을 구한다면 꼭 첫달 월세를 확인하세요!! (0) | 2019.07.03 |
| jenkins 설치 및 연동 (0) | 2019.05.14 |


